Industry Insights Report

Primary Metal Manufacturing

NAICS 331
GLS Insights Primary Metal Manufacturing report evaluates the location quality and the operating cost for a primary metal manufacturing facility across the metros of your choosing. The report provides insights into all MSAs for a primary metal manufacturing facility based on scores calculated utilizing more than 100 data points.

Select Region(s):

Select one or more regions you wish to purchase. Reports may be purchased by region or a bundle which includes the entire United States. Click here for a U.S. map that includes states and MSAs for each region.
$99 per region or $495 for the entire U.S.

South Atlantic

Northwest

Southwest

West North Central

West South Central

East North Central

East South Central

Northeast

Entire U.S. (All 8 Regions)

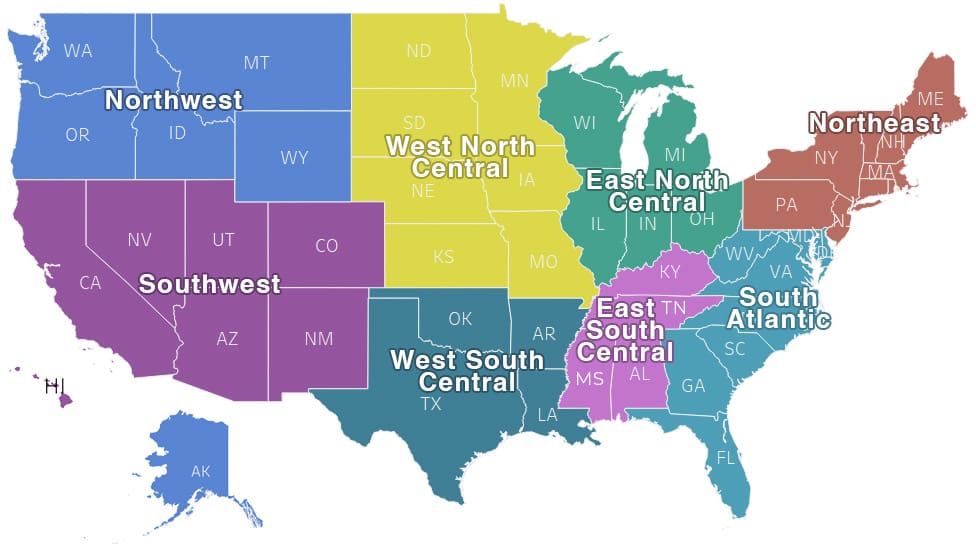
Regions of the United States

To get the most detailed information on your specific location, GLS divides the United States into 8 regions: Northwest, West North Central, East North Central, Northeast, Southwest, West South Central, East South Central, and South Atlantic. Click here to see which of the 50 states and 384 MSAs are included within each region.

Industry: Primary Metal Manufacturing


NAICS Code(s): 331


Industry Description: The primary metal manufacturing sector encompasses industries engaged in the smelting or refining of metals or alloys with various metal combinations, for the subsequent production of refined metal products and various metal goods. This sector plays a vital role in industrial advancement by supplying the raw materials essential for various applications in industries such as construction, automotive, and energy.


Active Investors: Ball, Bodycote, Central States Manufacturing, Crown Holdings, JSW Steel, LG Chem, Novelis, Nucor, Steel Dynamics, and US Steel.

What’s Included in Each Report?

  • Industry Overview and Trends
  • Recent Announcements
  • Industry Insights
  • Methodology
  • Rankings

Best Places for Food Manufacturing Report

With changing consumer preferences, a strained labor pool and increased focus on sustainability, GLS takes a deep dive into the industry and reveals the best places for food manufacturing across the US.

Methodology

Our data-driven methodology provides the backbone of every report and enables weighted comparative scoring of qualitative factors, operating cost snapshots, and trend analysis by industry sector for metros across the U.S.

Each quarter, our team collects granular data from more than a dozen data sources and uses it to analyze more than 100 criteria in seven main categories.

K

Demographics + Labor Force

Population, Labor Force, Veterans Labor Force, Future Workforce Pipeline

K

Education

Educational Attainment, K-12 Educational System Effectiveness, Industry Talent Pipeline

K

Workforce Availability

Manufacturing + Target Industry, Labor Relations + Turnover, Growth + Retirement, Target Industry Occupations

K

Operational and Regulatory Environment

Regulatory Environment, Environmental Resilience, State Tax Environment

K

Community Well-Being and Livability

Commuting Patterns, Economic Well-Being + Affordability Metrics, Community Health Indicators, Housing Availability

K

Infrastructure

Rail Network, Interstate + U.S. Highway Network, Air Network, Road Infrastructure Condition + Quality, Electricity

K

Industry Ecosystem

Supply Chain (Suppliers), Industry Strength, Supply Chain (Buyers)

Why GLS Insights?

Expert Insights

Our analysts are site selection pros and highly regarded within the field. They understand industry expectations.

Data-Backed Decisions

Our time-tested methodology and up-to-date data will enable you to move forward with confidence.

No Fluff

Your time is essential. Our reports are easy to read and deliver the analytics you need to inform your future decisions.